Our team brings a profound insight into Glendale's legal framework and a pledge to offer supportive and powerful legal representation. We are dedicated to guiding you through your personal injury claim. Our expertise spans various cases, including car accidents, slip and fall occurrences, workplace injuries, and other personal injury matters. Our seasoned attorneys are geared up to assertively protect your rights.
Our skilled team is at your service. Reach out to us now for a complimentary consultation. Our fee structure is simple: You only pay when we win your case.
If you’ve been involved in a car accident in Glendale, you understand the physical, emotional, and financial toll it can take. At Avian Law Group, we specialize in car accident claims, offering expert legal guidance to ensure you’re fairly compensated for your losses. Our experienced attorneys understand the nuances of California’s traffic laws and are dedicated to advocating for your rights, helping you to navigate the complexities of insurance claims and legal proceedings with ease and confidence.
As per Allstate’s data, Glendale drivers are involved in a collision, on average, every 5.5 years, making them 83 percent more likely to experience an accident compared to the national average. While this may initially appear concerning for Glendale, it’s crucial to approach this information with caution and consider the report’s accuracy before forming definitive conclusions, as some experts have suggested.
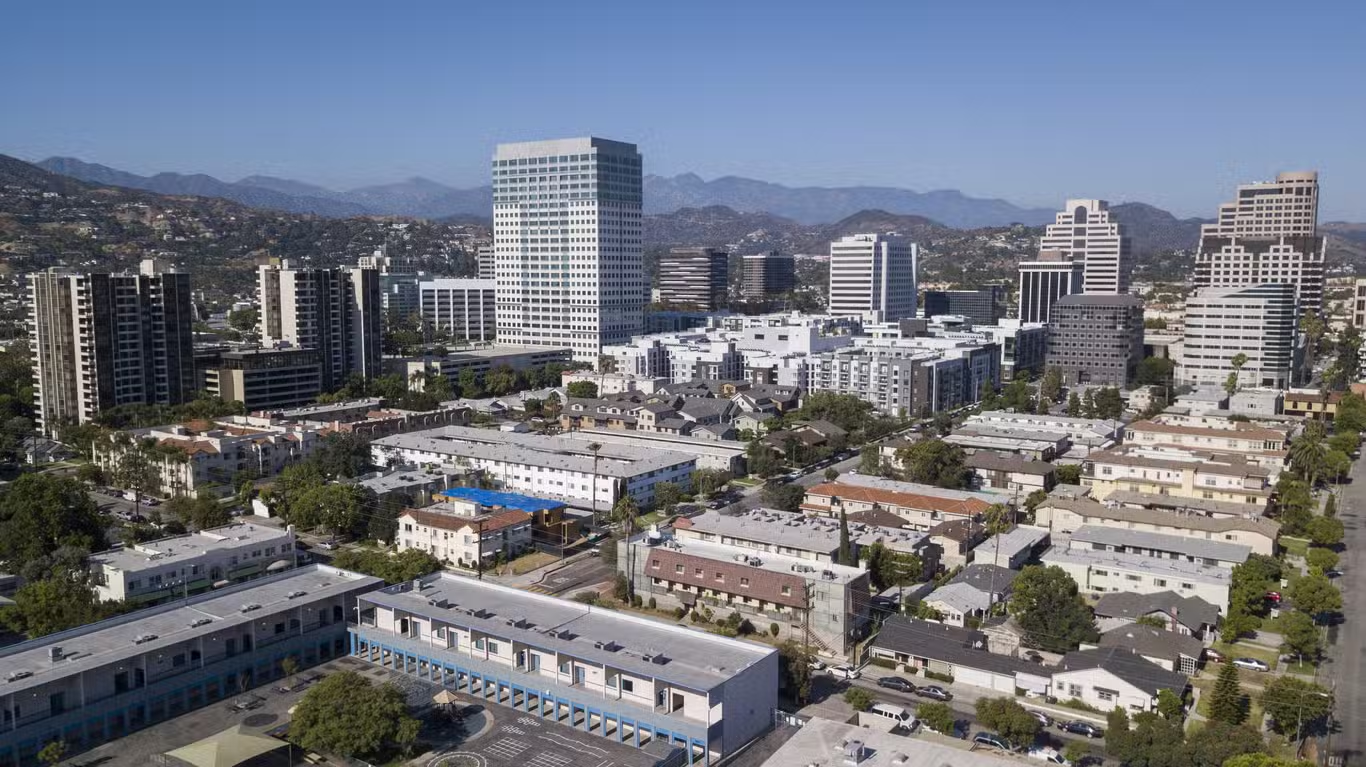
Why do Glendale commuters, a population of just over 203,000, often find themselves stressed during their daily journeys to and from work? Let’s delve into the study’s findings.
Common Types of Personal Injury Cases in Glendale
On average, Glendale residents spend approximately 27.9 minutes on the road for a one-way commute.
Glendale experiences an average of 43 rainy days each year.
The likelihood of being involved in an accident during a commute is significantly higher for Glendale residents, with a staggering 99.4% increase compared to the general U.S. population.
This statistic is further compounded by the fact that 85.3% of Glendale residents rely on cars for their daily commute.
Among the cities surveyed, Glendale ranked the worst in terms of traffic congestion during commuting hours. This concentration of vehicles on the road simultaneously exacerbates traffic problems and elevates the risk of accidents.
With 85.3% of the workforce spending nearly an hour commuting each way, it’s not surprising that drivers often become frustrated. However, the true danger arises when frustration leads to unlawful driving behaviors.
Aggressive driving and road rage are all too common on Glendale’s roads. These behaviors can include:
Speeding
Tailgating
Frequent lane changes
Rapid acceleration and braking
Ultimately, aggressive driving escalates into “road rage,” a dangerous set of behaviors intentionally putting others at risk. Examples of road rage include:
Deliberate collisions with other vehicles
Cutting off fellow drivers
Ignoring traffic signals and signs
Excessive honking or flashing lights
Making obscene gestures
Verbal threats
Displaying weapons
Following another driver off the road or into a parking area
It is crucial for Glendale’s commuters to remain patient, courteous, and safe on the roads to avoid the potentially severe consequences of aggressive driving and road rage.
Crime Rate Statistics for Glendale, CA
The crime rate in Glendale is higher than the national average, with 19 crimes per one thousand residents. However, it is not among the communities with the very highest crime rate. The chance of becoming a victim of either violent or property crime in Glendale is 1 in 52. Compared to other communities of similar population size, Glendale’s crime rate is lower than the average, making it safer than most similar-sized cities in America.
Violent Crime Rate
Glendale’s violent crime rate is 1 per one thousand inhabitants, which is about average for all communities in America, regardless of population size. The types of violent crimes tracked include armed robbery, aggravated assault, rape (not statutory), and murder and non-negligent manslaughter. The chance of becoming a victim of violent crime in Glendale is one in 962.
Property Crime Rate
The rate for property crime in Glendale is 18 per one thousand population, indicating an above-average chance of becoming a victim of property crime compared to other American communities. The chance of becoming a victim of property crime in Glendale is one in 55.
Projected Crime Data for 2023 in Glendale, CA
Aggravated Assault: 88 incidents
Arson: 12 incidents
Burglary: 407 incidents
Larceny and Theft: 2,381 incidents
Motor Vehicle Theft: 277 incidents
Murder and Manslaughter: 5 incidents
Rape: 33 incidents
Robbery: 77 incidents
Total Crime Rate (Total Incidents): 3,590
Property Crime: 3,061 incidents
Violent Crime: 203 incidents
These statistics suggest an overall downward trend in crime in Glendale based on data from the past 21 years, with both violent and property crime decreasing. The crime rate for Glendale in 2023 is expected to be lower than in 2019. In 2019, Glendale’s violent crime rate was significantly lower than both the national and California averages, and its property crime rate was also lower than these averages.